Ñïàñèáî, ÷òî ïîìîãàåòå ñòàòü íàì ëó÷øå 
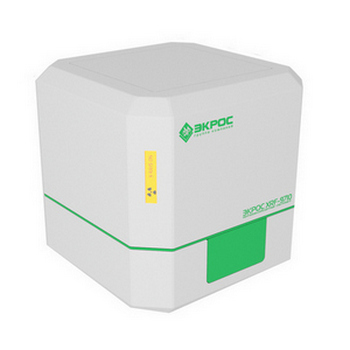
Coating thickness analysis using the X-ray fluorescence spectrometer EÑROS XRF-9710 PEARL
In the modern world, there are many technologies and methods for coating various materials and surfaces. These can be paint coatings, protective coatings, decorative and others. During the production and operation of these coatings, it is necessary to control their thickness to ensure quality and efficiency.
Coating thickness analysis is an important step in the quality control of coatings and their durability. The thickness of the coating affects many parameters such as adhesion, strength, wear resistance, corrosion resistance and others. If the coating is too thin, it may not perform its functions properly, and if it is too thick, it may lead to overspending of material and an increase in cost.
One of the main applications of coating thickness analysis is the quality control of coatings during production and operation. For example, when painting cars, it is important to monitor the thickness of the paint layer to ensure its durability and aesthetic appearance.
Various methods are used to measure the thickness of coatings. The most common are magnetic thickness gauges, ultrasonic thickness gauges, X-ray fluorescence spectrometers and eddy current devices. The choice of measurement method depends on the type of coating, substrate material and measurement conditions.
The XRF-9710 PEARL compact X-ray fluorescence spectrometer allows you to analyze the thickness of the coating.
As an example, we present the analysis of a foil sample:
X-ray fluorescence spectrometer
EÑROS XRF-9710 PEARL
Investigation of the coating thickness
Foil samples are presented for the study.
Measurements of sample ¹1 were carried out along the short side through 1 cm in a helium atmosphere (Fig. 1).
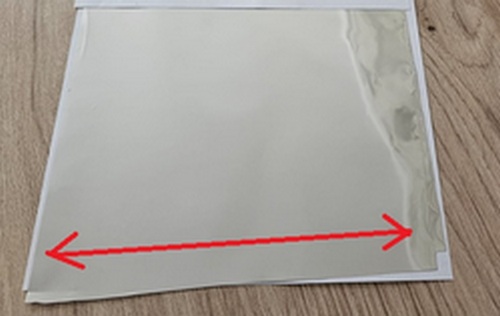
Fig. 1. Foil sample ¹ 1 provided for the study.
The distribution of the intensities of the aluminum signals from the position is shown in Fig. 2.
The frequency response of the aluminum signal for 5 measurements of the same point is ~ 100 pulses, which is ~0.02 OD.
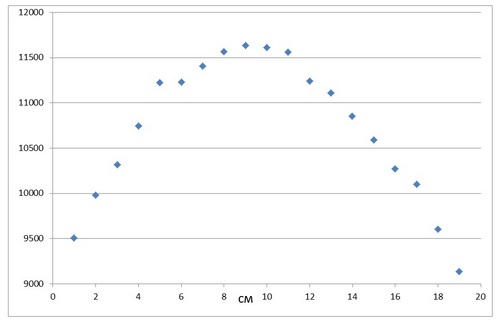
Fig. 2. The intensity of the aluminum signal depends on the position.
Chromium and a significant amount of zinc were found (Fig. 4, 5) in the color-changing film (sample ¹ 2 - Fig. 3). The dependence of peak intensities on position is shown in Fig. 6, 7.

Fig. 3. Foil sample ¹ 2 provided for the study.
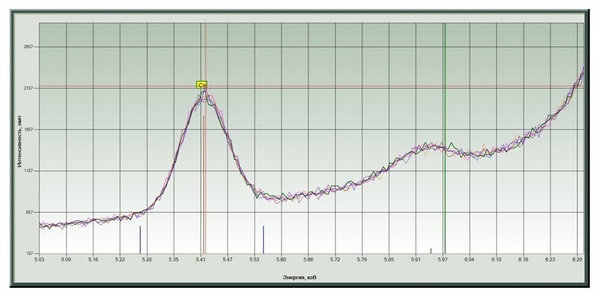
Fig. 4. Chromium signals at different points.
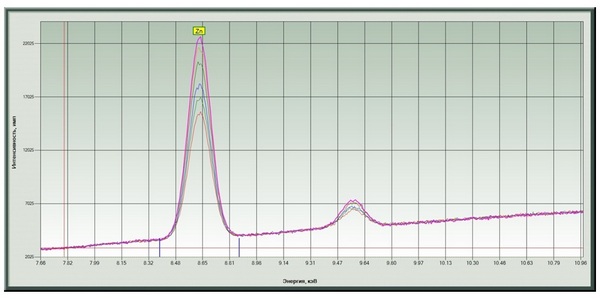
Fig. 5. Zinc signals at different points.
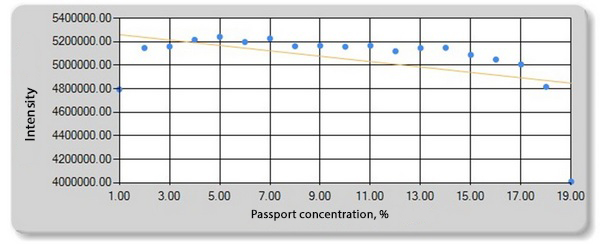
Fig. 6. Dependence of the chromium intensity on the distance from the edge of the film.
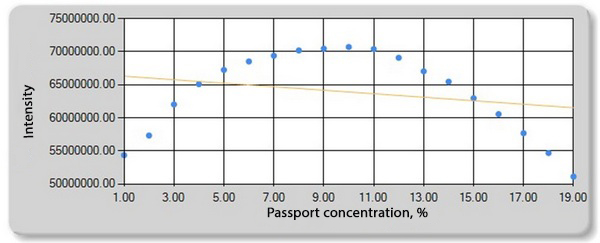
Fig. 7. Dependence of zinc intensity on the distance from the edge of the film.
You can order a spectrometer by following the link:
XRF-9710 PEARL compact X-ray fluorescence spectrometer

